Using the Map
Our map can be browsed in an interactive, visual mode or as plain-text. This guide describes how to use the interactive map.When the interactive map opens, it defaults to a geographic display of all entities and links in the database in the upper right pane and with searching and filtering tools open in the left pane. In this display, you can:
- Hover over an entity to display the entity's name
- Hover over a link to display the names of the linked entities and the link type.
- Click on an entity to open a text box with address and summary, and the full entry of the entity in the lower right pane, including the types of harm in which the entity is complicit, and all the links connecting it to other entities on the map.
- Click on a link to open a text box with a full description of the link.
Clicking on "Hide Searching and Filtering Tools" at the top of the left pane will close the left pane to allow for a larger representation of the visual map.
Geographic vs. Graph View
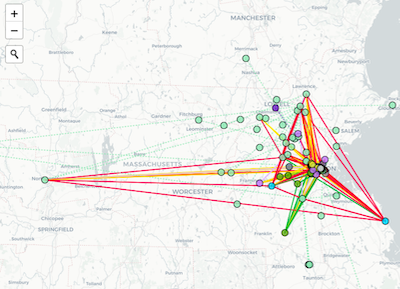
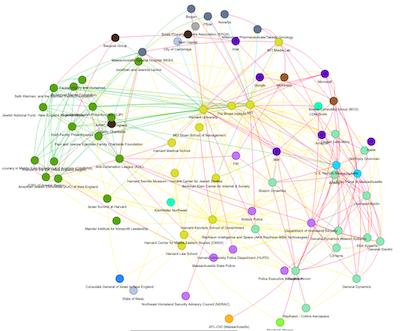
By selecting either Geographic or Graph view under View in the left pane, the map can be represented either as physical entities shown as pins on a geographic map or as nodes and links in a non-geographic display.
Searching and Filtering
Search
The top box in the left pane allows for searching entities by name, by keywords in the entity's description, by Entity Type, by Harm category, and by Link Type (see our definitions). For a detailed explanation of the search function, click Show/Hide Additional Search Instructions.Clicking in the search box immediately opens an alphabetical list of all entities in the database, which can then be selected individually or cumulatively for display on the map. Although the search function is set to clear all other entities from the map as soon as one begins selecting entities from the list, since the default when the map opens is to display links Between selected entities and all other entities (see "Show links" below), selecting entities when starting from the default view will also populate the map with other entities to which selected entities are linked. To view the selected entities alone, it's thus necessary either to uncheck the Show links box, or to check the option for viewing links Between selected entities.
Search within an entity's description: The Search within description box under the map in the right pane allows for a keyword search within the long description of a displayed entity. Search terms will be shown highlighted in yellow for quick reference.
View
Show LinksClicking the Show links box will display links of the types listed in the Link types section below the View section (Association/Collaboration, Financial Support, Partnership/Ownership/Membership, Product Link, Real Estate Link), represented by solid lines on the map. These links can be displayed either Between selected entities on the map, or Between selected entities and all other entities to which they are linked. The second option will automatically populate the map with any other entities to which the selected entities are linked.Show Master Entity Links
Clicking this box allows for display of links between a master entity and its subsidiaries, represented by broken grey lines on the map. This only applies to Geographic View.Show Multiple Address Links
Clicking this box allows for display of links between multiple addresses for the same entity, represented by dotted lines on the map. This only applies to Geographic view.Show entity labels, Show link labels
Clicking these boxes will display the names of entities and the brief link descriptions without the need to hover over entities and links. This only applies to Geographic View.
Applying filters: Link Types, Entity Types, Harm Categories
Colored boxes show that Link types and Entity types of the corresponding type and color are currently displayed on the map. Clicking the pink boxes under Harm categories will display entities complicit in the corresponding harm category. By default, all boxes are clicked (which shows all entities in the database). Clicking a colored box will gray it out and remove the corresponding Link type, Entity type or Harm category from the map. Clicking a grayed out box will restore the corresponding Link type, Entity type or Harm categories to the map. For all three filtering catagories, the Clear button can be used to remove all types/categories, and Select All can be used restore all types/categories.Using the Clear button either for Entity types or for Harm categories will automatically remove all entities from the map.
The Harm categories filter allows for and filtering (displaying only entities with all the harm categories selected), as well as for or filtering (displaying all entities with any of the harm categories selected).
Using map overlays
We have also developed several overlays that can be added to the map, in geographic view:
Land-grab Universities
At the bottom of the left pane, the Land-grab universities section allows for a display (in geographic view) of real-estate in the immediately surrounding community owned by each of the universities listed. (To view this feature alone, it's necessary to first clear the map of any other entities displayed.) Since some of these unversities (e.g., Harvard) own real estate throughout the country and around the globe, this is not a full representation of their real estate ownership - only a picture of their footprint in the communities where they are situated. These data were obtained from the Boston government's website and reflect real estate holdings as of 2021 (data obtained from MassGIS).
Funding by US War Machine
Show the locations of recipients of funding from the US Department of Defense and/or Department of Homeland Security, considering recipients with contracts/awards active in 2021 (source: USASpending.gov). Clicking on a recipient will show recipient's name, address, the total amount of funding it has received, and the names of the funding agencies. Markers for recipients with substantially larger funding received (e.g., over a million or a billion) will be shown in darker shade of red and larger size.
Prisons/Police
Show policeShows locations of police stations as blue dots (source: MassGIS).Show prisonsShows locations of prisons as orange dots (source: MassGIS).
Evictions
Show eviction filings (2015-2022)Shows eviction filings from 2015-2022 (source: MassCourts). Each eviction filing will be shown as a grey dot. Clicking on the dot will show information about the eviction filing such as the address, the name of the landlord who filed the eviction filing, and the name of the judge that presided over the eviction hearing (if available). While these eviction filings already paint a devastating picture, they are surely an underestimate of evictions in the Boston area. Evictions in criminalized communities often take place informally, through intimidation, coercion, or punitive rent increases, without leaving a legal record.